파이썬/Fast API
pyinstrument : 성능 최적화를 위한 프로파일링
코샵
2025. 2. 11. 10:25
반응형
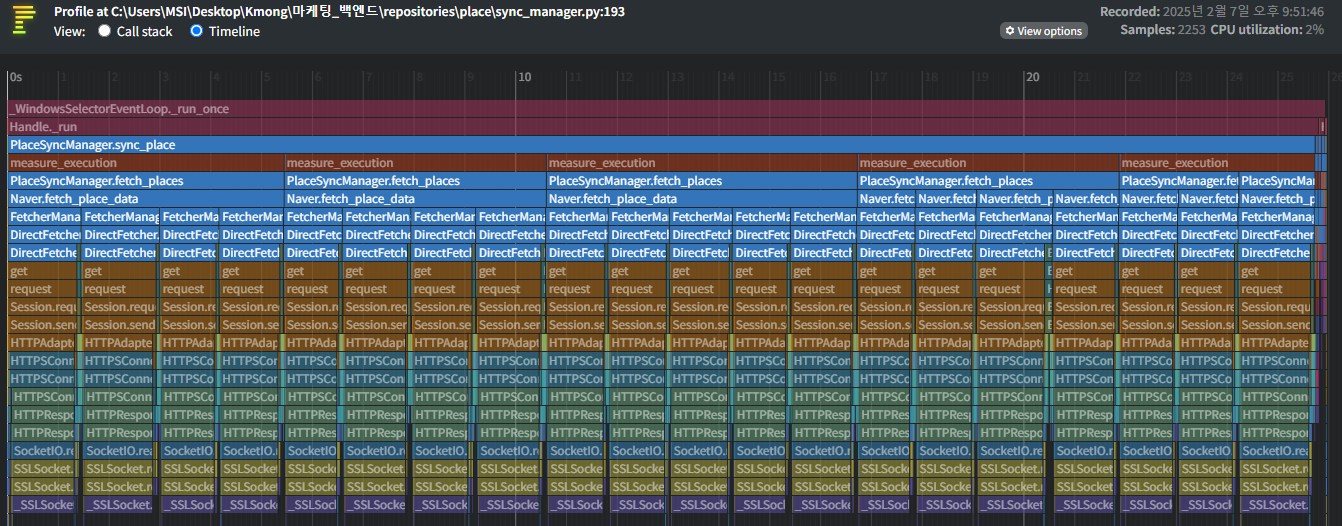
pyinstrument는 Python 코드의 성능을 프로파일링하는 강력한 도구입니다. 특히 FastAPI 애플리케이션에서 병목 현상을 찾고 성능을 최적화하는 데 매우 유용합니다.
기본 설정
from fastapi import FastAPI
from pyinstrument import Profiler
from pyinstrument.middleware import ProfilerMiddleware

app = FastAPI()

# 전체 애플리케이션 프로파일링
app.add_middleware(ProfilerMiddleware)

# 특정 엔드포인트 프로파일링
@app.get("/users/{user_id}")
async def get_user(user_id: int):
    profiler = Profiler()
    profiler.start()

    # 실제 로직 수행
    result = await fetch_user_data(user_id)

    profiler.stop()
    return {
        "data": result,
        "profile": profiler.output_text()
    }
고급 프로파일링 설정
from fastapi import FastAPI, Request
from pyinstrument import Profiler
from functools import wraps

def profile_endpoint(enabled: bool = True):
    def decorator(func):
        @wraps(func)
        async def wrapper(*args, **kwargs):
            if not enabled:
                return await func(*args, **kwargs)

            profiler = Profiler(
                interval=0.001,  # 샘플링 간격
                async_mode='enabled'
            )
            profiler.start()

            try:
                result = await func(*args, **kwargs)
                return result
            finally:
                profiler.stop()
                print(profiler.output_text(
                    show_all=True,
                    timeline=True
                ))

        return wrapper
    return decorator

app = FastAPI()

@app.get("/expensive-operation")
@profile_endpoint(enabled=True)
async def expensive_operation():
    # 시간이 많이 소요되는 작업
    result = await complex_calculation()
    return {"result": result}
커스텀 미들웨어 구현
from fastapi import FastAPI, Request
from pyinstrument import Profiler
import time
from pathlib import Path

class CustomProfilerMiddleware:
    def __init__(
        self,
        app,
        profile_path: str = "profiles",
        min_duration: float = 0.5
    ):
        self.app = app
        self.profile_path = Path(profile_path)
        self.min_duration = min_duration
        self.profile_path.mkdir(exist_ok=True)

    async def __call__(self, request: Request, call_next):
        profiler = Profiler(async_mode='enabled')
        profiler.start()

        start_time = time.time()
        response = await call_next(request)
        duration = time.time() - start_time

        profiler.stop()

        # 지정된 시간 이상 소요된 요청만 프로파일 저장
        if duration >= self.min_duration:
            timestamp = time.strftime("%Y%m%d-%H%M%S")
            path = self.profile_path / f"profile-{timestamp}.html"

            with open(path, "w", encoding="utf-8") as f:
                f.write(profiler.output_html())

        return response

app = FastAPI()
app.add_middleware(CustomProfilerMiddleware)
데이터베이스 쿼리 프로파일링
from fastapi import FastAPI, Depends
from sqlalchemy.orm import Session
from pyinstrument import Profiler
from typing import List

app = FastAPI()

class QueryProfiler:
    def __init__(self):
        self.profiler = Profiler(async_mode='enabled')

    async def profile_query(self, query_func):
        self.profiler.start()
        try:
            result = await query_func()
            return result
        finally:
            self.profiler.stop()
            print(self.profiler.output_text(
                unicode=True,
                color=True
            ))

@app.get("/users/")
async def get_users(
    db: Session = Depends(get_db),
    limit: int = 10
):
    profiler = QueryProfiler()

    async def query_users():
        return db.query(User).limit(limit).all()

    return await profiler.profile_query(query_users)
성능 메트릭 수집
from fastapi import FastAPI
from pyinstrument import Profiler
from prometheus_client import Counter, Histogram
import time

# 메트릭 정의
PROFILE_TIME = Histogram(
    'request_profile_seconds',
    'Time spent in profiled endpoints',
    ['endpoint']
)

PROFILE_CALLS = Counter(
    'profile_calls_total',
    'Number of profiled calls',
    ['endpoint']
)

def collect_metrics(endpoint: str):
    def decorator(func):
        @wraps(func)
        async def wrapper(*args, **kwargs):
            profiler = Profiler()
            start_time = time.time()

            profiler.start()
            try:
                result = await func(*args, **kwargs)
                return result
            finally:
                profiler.stop()
                duration = time.time() - start_time

                # 메트릭 기록
                PROFILE_TIME.labels(endpoint).observe(duration)
                PROFILE_CALLS.labels(endpoint).inc()

                # 프로파일 결과 저장
                print(profiler.output_text())

        return wrapper
    return decorator

app = FastAPI()

@app.get("/api/data")
@collect_metrics("get_data")
async def get_data():
    # 데이터 처리 로직
    return {"status": "success"}
프로파일링 결과 분석
from pyinstrument import Profiler
from datetime import datetime
import json

class ProfileAnalyzer:
    def __init__(self):
        self.profiles = []

    def add_profile(self, profile_data: dict):
        timestamp = datetime.now().isoformat()
        self.profiles.append({
            "timestamp": timestamp,
            "data": profile_data
        })

    def analyze(self):
        if not self.profiles:
            return "No profiles collected"

        total_time = sum(p["data"]["duration"] for p in self.profiles)
        avg_time = total_time / len(self.profiles)

        return {
            "total_profiles": len(self.profiles),
            "average_duration": avg_time,
            "max_duration": max(p["data"]["duration"] for p in self.profiles),
            "min_duration": min(p["data"]["duration"] for p in self.profiles)
        }

    def export_results(self, filename: str):
        with open(filename, 'w') as f:
            json.dump(self.profiles, f, indent=2)

# 사용 예시
analyzer = ProfileAnalyzer()

@app.get("/complex-operation")
async def complex_operation():
    profiler = Profiler()
    profiler.start()

    # 복잡한 작업 수행
    result = await perform_complex_task()

    profiler.stop()
    analyzer.add_profile({
        "duration": profiler.duration,
        "profile": profiler.output_text()
    })

    return result
pyinstrument를 사용하면 FastAPI 애플리케이션의 성능을 상세하게 분석하고 최적화할 수 있습니다. 특히 실제 운영 환경에서 발생하는 성능 문제를 찾아내고 해결하는 데 매우 유용합니다.